Plastics Trade and Waste Outlook, Rising Exports, Mounting Environmental Challenges (1950-2050)
Global plastics production and exports have expanded rapidly over the past seven decades, with countries such as the U.S., China, Germany, and India driving trade growth. While global exports surged to billions of dollars annually, the environmental cost continues to escalate over 8,300 million metric tons of plastics have been produced to date, and waste accumulation could exceed 12,000 Mt by 2050. The report examines international trade trends, recycling gaps, and the urgent need for sustainable management strategies to curb plastic pollution worldwide.
Ottawa, Nov. 04, 2025 (GLOBE NEWSWIRE) -- According to Towards Packaging, a sister firm of Precedence Research, global plastics production and trade have expanded dramatically over the past decades, with countries such as the U.S., China, Germany, and India driving growth across industrial and consumer sectors. However, this surge has intensified environmental concerns billions of tons of plastics have been produced, with only a small fraction recycled. As waste volumes continue to rise, the report emphasizes the urgent need for global collaboration, advanced recycling technologies, and sustainable material innovations to mitigate long-term ecological impacts.
Request Research Report Built Around Your Goals: sales@towardspackaging.com
Between April and September 2022, India’s plastic exports reached around USD 6.38 billion, reflecting a healthy performance across several product segments. Notably, exports of plastic raw materials, medical-grade plastic items, and pipes and fittings surged by 32.3%, 24.8%, and 17.9%, respectively, compared with the same period a year earlier.
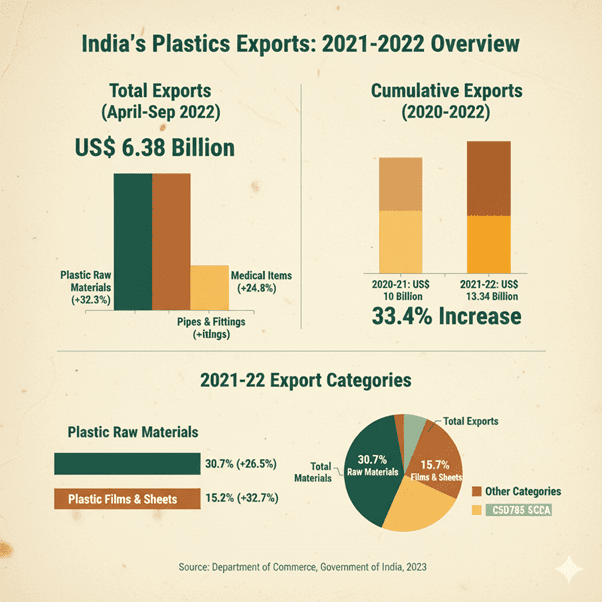
For the financial year 2021–22, India’s total plastics and related materials exports amounted to USD 13.34 billion, marking a strong 33.4% growth from USD 10 billion in 2020–21. Within this, plastic raw materials dominated the export basket, accounting for 30.7% of total exports and expanding by 26.5% year-over-year. The films and sheets segment ranked second, contributing 15.2% of total exports, with an impressive 32.7% annual growth.
In May 2022 alone, the combined exports of plastics and linoleum were valued at USD 1.07 billion. During this month, key categories such as medical plastic products, films and sheets, pipes and fittings, FRP & composites, packaging materials, cordage, fishnets, monofilaments, and miscellaneous products recorded significant gains. Overall, exports for April–May 2022 stood at USD 2.17 billion, up 2.6% year-on-year, underscoring the continued momentum in India’s plastics trade.
Export Destinations
India’s plastic products reach over 200 countries worldwide, showcasing the nation’s growing global footprint in the plastics trade. Among these, the United States, Germany, Japan, the United Kingdom, and France stand out as the leading importers of Indian consumer and houseware plastic products.
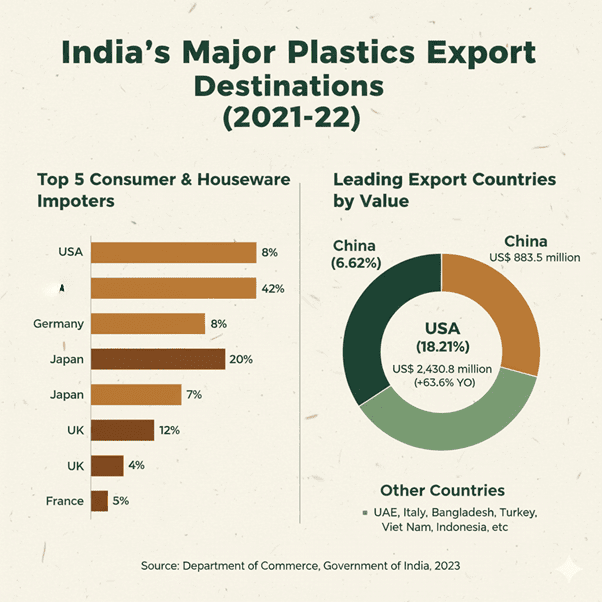
The country’s major export markets also include China, the UAE, Italy, Bangladesh, Nepal, Turkey, Vietnam, and Indonesia, highlighting a diverse and geographically balanced trade network.
In 2021-22, the United States emerged as the largest destination for India’s plastic exports, with shipments valued at USD 2.43 billion, reflecting a robust 63.6% year-on-year growth. China followed as the second-largest market, importing goods worth USD 883.5 million. Together, these two countries accounted for 18.21% and 6.62%, respectively, of India’s total plastic exports during the year, underscoring their significant role in driving export growth.
Global Plastic Production and Environmental Outlook
Plastics have surpassed most synthetic materials in both production and application, becoming an integral part of modern life. However, this rapid growth has also placed them at the center of global environmental concern. Despite their widespread use, comprehensive information about the complete life cycle of plastics from production to disposal has remained limited.
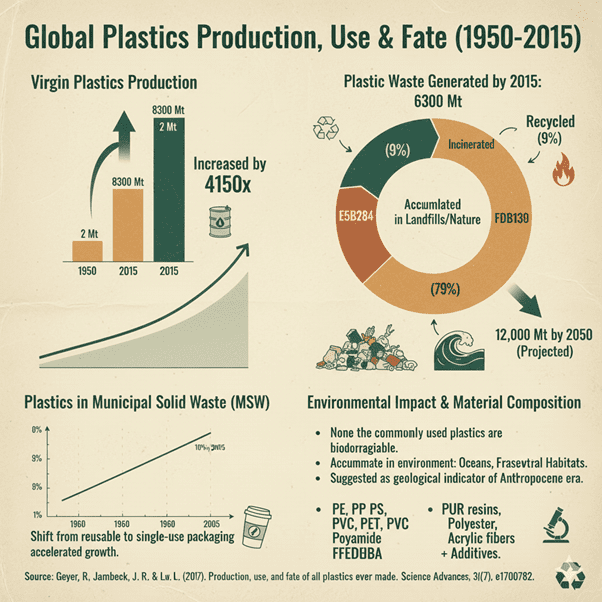
By consolidating global data on the manufacture, utilization, and disposal of polymer resins, synthetic fibers, and chemical additives, researchers have developed the first-ever holistic assessment of plastic production and its end-of-life fate. It is estimated that approximately 8,300 million metric tons (Mt) of virgin plastic have been produced globally to date. By 2015, around 6,300 Mt of plastic waste had already been generated, of which only 9% had been recycled, 12% incinerated, and a staggering 79% accumulated in landfills or the natural environment. If current consumption and waste management practices continue, an estimated 12,000 Mt of plastic waste could end up in landfills or polluting the environment by 2050.
Market Dynamics and Waste Generation
The packaging industry represents the largest market for plastics, fueled by the global transition from reusable materials to single-use containers. Consequently, the share of plastics in municipal solid waste (MSW) increased dramatically from less than 1% in 1960 to over 10% by 2005 in middle- and high-income nations. Parallel to this, the total generation of solid waste has risen consistently over the past fifty years, closely mirroring growth in per capita income.
Environmental Impact and Non-Biodegradability
Most plastics are produced from fossil fuel–based monomers such as ethylene and propylene. Unfortunately, none of the widely used polymers are biodegradable, meaning they persist for centuries once discarded. As a result, plastic waste accumulates in landfills and natural habitats, contributing to long-term pollution. The only permanent way to remove plastic waste is through destructive thermal processes like incineration or pyrolysis, though these come with their own environmental challenges.
Plastic contamination has now become pervasive plastic fragments and microplastics have been detected in all major ocean basins. In 2010 alone, between 4 and 12 million metric tons of plastic waste generated on land were estimated to have entered marine environments. Similar contamination has also been observed in freshwater bodies, soil ecosystems, and even air, while synthetic fibers continue to infiltrate terrestrial and aquatic habitats. The scale of this pollution has become so extensive that scientists propose it as a defining feature of the Anthropocene epoch, symbolizing humanity’s impact on Earth’s geology.
Material Composition and Analysis
The global assessment includes a range of mass-produced plastic materials, such as thermoplastics, thermosets, polyurethanes (PURs), elastomers, coatings, and sealants. The analysis primarily focuses on key resins and fibers like high-density polyethylene (HDPE), low-density polyethylene (LDPE), linear low-density polyethylene (LLDPE), polypropylene (PP), polystyrene (PS), polyvinyl chloride (PVC), polyethylene terephthalate (PET), and polyurethane (PUR). Among synthetic fibers, polyester, polyamide, and acrylic (PP&A) dominate production. Each polymer is typically combined with additives to enhance durability, flexibility, and resistance factors that, while improving performance, further complicate waste management and recycling.
Results and Discussion
Global production of plastic resins and synthetic fibers has grown at an extraordinary pace over the past seven decades. From a modest 2 million metric tons (Mt) in 1950, production soared to approximately 380 Mt in 2015, representing a compound annual growth rate (CAGR) of 8.4% more than double the growth rate of global GDP during the same period. Between 1950 and 2015, the world produced nearly 7,800 Mt of resins and fibers, with half of this output generated within just the past 13 years, highlighting the exponential rise in demand. Presently, China leads global production, contributing about 28% of total resin output and an overwhelming 68% of PP&A (polyester, polyamide, and acrylic) fiber production. While bio-based and biodegradable plastics have emerged as alternatives, their combined global production capacity remains limited at around 4 Mt, and thus they are not included in this analysis.
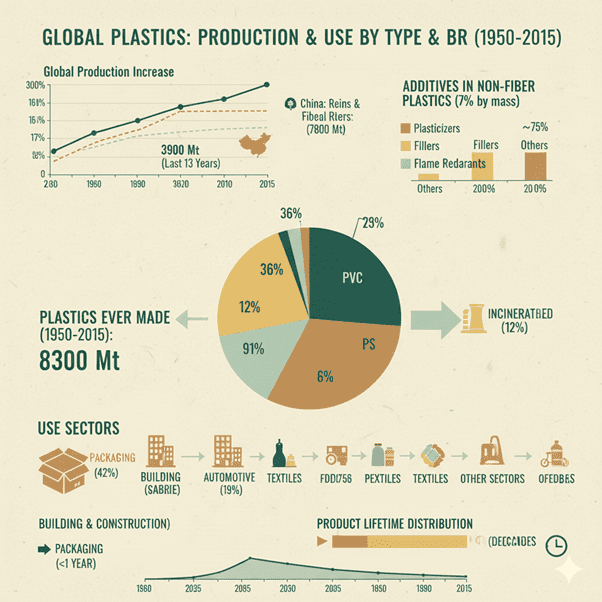
To capture a comprehensive view of global plastic production, data were compiled from various industry sources covering resins, fibers, and additives, and categorized according to material type and application sector. Historically, detailed statistics on fiber and additive production were scarce, making this a significant step toward a complete material flow model. Findings indicate that nonfiber plastics are composed of roughly 93% polymer resin and 7% additives by mass. When additives are factored in, the total production of nonfiber plastics since 1950 rises to 7,300 Mt, with another 1,000 Mt contributed by PP&A fibers. Among additives, plasticizers, fillers, and flame retardants make up about 75% of total usage.
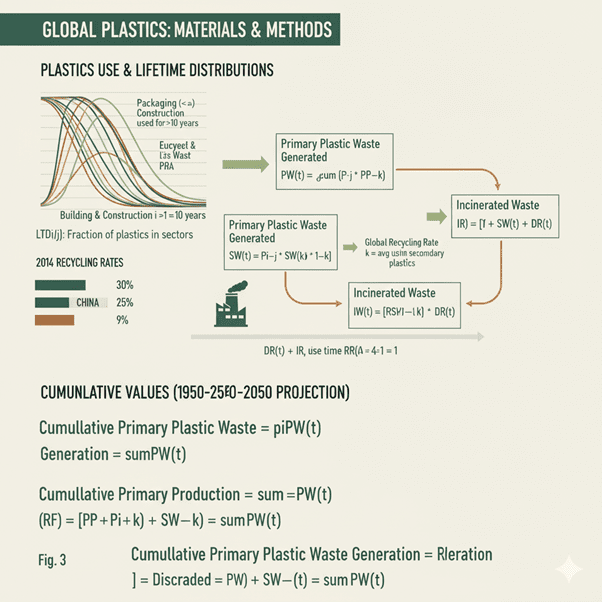
In terms of material type, the largest share of nonfiber plastics comes from polyethylene (PE) at 36%, followed by polypropylene (PP) at 21%, and polyvinyl chloride (PVC) at 12%. Other major contributors include polyethylene terephthalate (PET), polyurethane (PUR), and polystyrene (PS), each representing less than 10% of total production. On the fiber side, polyester mostly PET-based accounts for nearly 70% of all PP&A fibers. Collectively, these seven key polymer groups make up approximately 92% of all plastics ever manufactured.
When broken down by end-use, packaging applications dominate the market, accounting for about 42% of total nonfiber plastic consumption, primarily involving PE, PP, and PET. The building and construction sector follows as the second-largest consumer, responsible for around 19% of nonfiber plastics, particularly PVC, which represents nearly 69% of plastic use in this sector.
To better understand plastic waste generation patterns, production data were combined with product lifetime models for eight major industrial sectors. These models estimate how long plastics remain in use before disposal, applying log-normal lifetime distributions that range from less than one year for packaging products to several decades for construction materials. Although this statistical approach effectively predicts waste accumulation trends, real-world data on solid waste composition and management remain limited in many countries, making direct measurement of global plastic waste generation challenging.
More Insights in Packaging Industry:
- Plastic Tubes Market Driven by 5.5% CAGR (2025-34)
- Plastic Tray Market Growth Drivers, Challenges and Opportunities
- Plant-Based Food Bioplastics Market Emerging Trends, Investment Opportunities
- Polystyrene (Ps) Plastic Punnets Market Strategic Analysis & Growth Opportunities
- Calcium Plastic Turnover Box Market Key Trends, Disruptions & Strategic Imperatives
- Plastic Tray and Container Market Strategic Analysis & Growth Opportunities
- Plastic Turnover Box Market Emerging Trends, Investment Opportunities
- Flexible Plastic Pouches Market Recycling Rates and Technologies
- Plastic Films and Sheets Market Trends, Disruptors & Competitive Strategy
- Biodegradable Plastic Films Market Strategic Growth, Innovation & Investment Trends
Product Lifetime and Plastic Waste Generation
Analysis of product lifetime distributions across eight major industrial sectors plotted using log-normal models reveals how long different types of plastics remain in use before disposal. These distributions vary widely depending on the product type: packaging materials typically have a lifespan of less than one year, while construction plastics can remain in use for several decades.
In 2015, approximately 407 million metric tons (Mt) of primary plastics (those produced from virgin raw materials) entered the use phase, while 302 Mt exited it. This indicates a net addition of 105 Mt to the global in-use plastic stock during that year. For comparison, in 2010, global plastic waste generation was estimated at 274 Mt, closely aligning with the 275 Mt reported by Jambeck et al., underscoring the reliability of these projections.
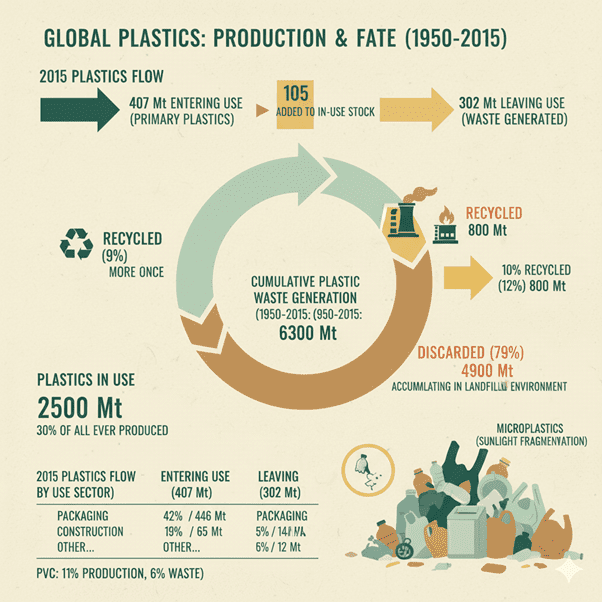
The variation in product lifespans causes notable shifts between the types of plastics being manufactured and those reaching their end of life each year. For instance, in 2015, 42% of newly produced nonfiber plastics (about 146 Mt) were used in packaging, while 19% (around 65 Mt) went into construction materials. However, when considering waste generation, 54% of plastics leaving use that year (approximately 141 Mt) were packaging-related, whereas only 5% (around 12 Mt) came from the construction sector. Similarly, polyvinyl chloride (PVC) made up 11% of plastic production (38 Mt) but represented only 6% of plastic waste (16 Mt), reflecting its longer product lifespan.
Global Plastic Waste Accumulation and Fate
By the end of 2015, cumulative plastic waste generated from all primary plastics reached roughly 5,800 Mt, including 700 Mt of PP&A (polyester, polyamide, and acrylic) fibers. The disposal pathways of plastic waste can be grouped into three main categories:
-
Recycling:
Plastic waste can be reprocessed into secondary materials, temporarily delaying disposal. However, recycling only reduces future waste if it substitutes new, virgin production a condition that is difficult to confirm. Additionally, polymer contamination and material mixing often produce lower-quality recyclates with limited industrial applications. -
Thermal Destruction:
Plastics can be incinerated, sometimes with energy recovery, or converted into fuel through pyrolysis. While these methods eliminate material mass, they can pose significant environmental and health risks if emission controls are inadequate or if incinerator designs are outdated. -
Disposal and Accumulation:
Plastics that are not recycled or incinerated are discarded either contained in landfills or left unmanaged in open dumps or natural environments. This is the most common outcome for plastic waste globally.
By 2015, an estimated 2,500 Mt of plastics (around 30% of all plastics ever produced) remained in use, while cumulative waste generation from both primary and recycled plastics reached 6,300 Mt. Of this total, about 800 Mt (12%) had been incinerated, and 600 Mt (9%) had been recycled only 10% of which were recycled more than once. The remaining 4,900 Mt (60%) were discarded and continue to accumulate in landfills and natural ecosystems.
Notably, around 600 Mt of discarded material consists of synthetic fibers such as PP&A. Since mass-produced plastics do not biodegrade, they gradually fragment under sunlight into smaller particles known as microplastics, which can range from millimeters to micrometers in size. Research into the environmental and ecological impacts of these microplastics especially in marine and freshwater systems has expanded significantly, though much less is currently known about their effects on land-based ecosystems.
Global Production, Use, and Fate of Plastics (1950–2015)
Between 1950 and 2015, the world witnessed a remarkable rise in the production and use of polymer resins, synthetic fibers, and chemical additives. However, the management of plastic waste has struggled to keep pace with this rapid growth.
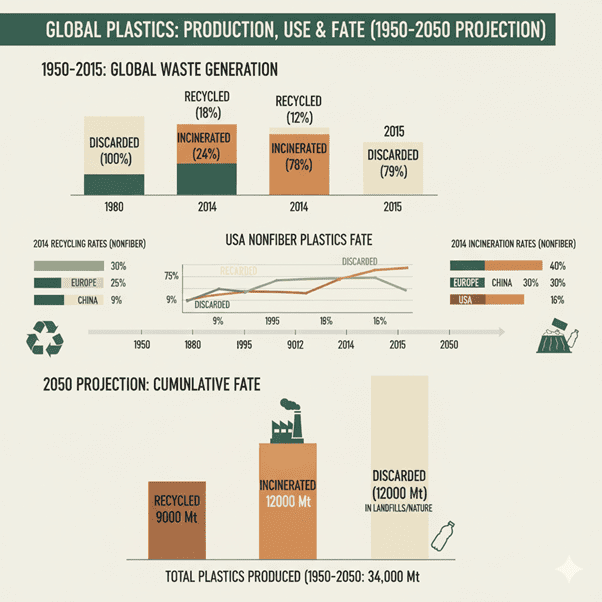
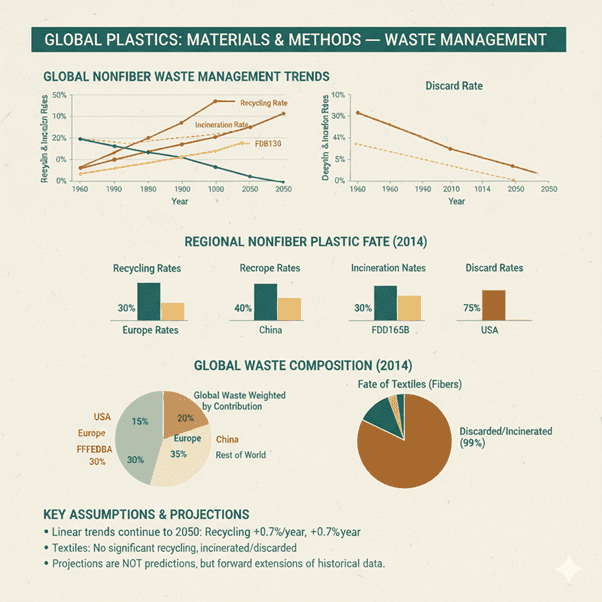
Prior to 1980, plastic recycling and incineration were virtually nonexistent. Only in the subsequent decades did nonfiber plastics begin to see notable efforts toward recycling and controlled disposal. By 2014, global recycling and incineration rates for nonfiber plastic waste had reached 18% and 24%, respectively marking gradual progress but still leaving a majority of waste to be discarded.
Regional Recycling and Disposal Trends
Recycling and waste management practices vary considerably across regions:
- Europe recorded the highest recycling rate in 2014 at approximately 30%, followed by China at 25%.
- In the United States, recycling of plastics has remained relatively low and stable at around 9% since 2012.
- Incineration rates also differ Europe reached around 40%, while China achieved 30% in 2014.
- In contrast, U.S. incineration of nonfiber plastics peaked at 21% in 1995 but later declined to 16% by 2014, reflecting a modest shift toward recycling. Despite this, discard rates in the U.S. have remained persistently high at around 75%.
- Data from 52 other countries show that most of the world had recycling and incineration levels similar to those of the United States during the same period, underscoring the global challenge in managing plastic waste effectively.
For fiber-based plastics and textiles, recycling remains minimal to negligible, with most fiber waste either incinerated or disposed of in landfills alongside general solid waste streams.
Future Projections to 2050
The historical trend of primary plastic production demonstrates consistent growth across all categories. If this trajectory continues, global manufacturing by 2050 is expected to reach:
- 26,000 million metric tons (Mt) of polymer resins,
- 6,000 Mt of synthetic fibers (PP&A), and
-
2,000 Mt of additives.
Assuming current consumption and waste management patterns persist, projections indicate that by 2050 the world will have generated:
- 9,000 Mt of recycled plastic waste,
- 12,000 Mt of incinerated waste, and
- Another 12,000 Mt of discarded plastics, either buried in landfills or released into the natural environment.
These figures emphasize the urgent need for innovative waste management solutions, recycling infrastructure expansion, and policy interventions to prevent further accumulation of plastic pollution in ecosystems.
Cumulative Plastic Waste Generation and Disposal (1950–2050)
The cumulative generation and disposal of plastic waste from 1950 to 2015 illustrate the long-term environmental implications of global plastic production. Historical data (1950–2015) are represented by solid trend lines, while dashed lines project future trajectories up to 2050, based on the continuation of historical growth and waste management patterns.
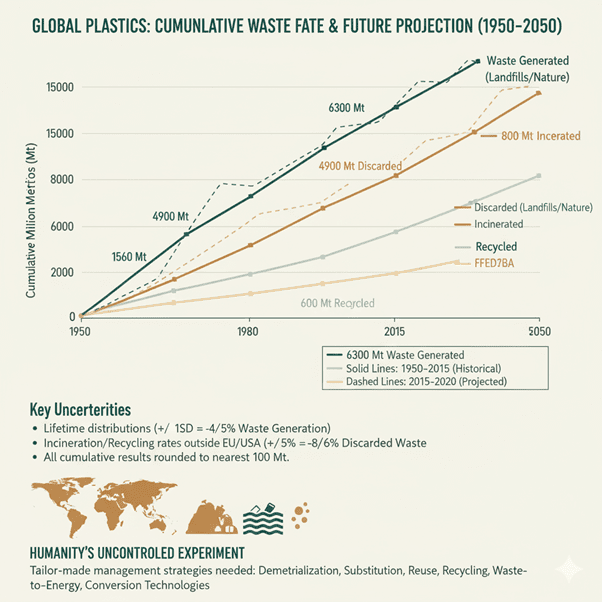
Every material flow analysis of this magnitude involves assumptions and simplifications. For this study, results have been rounded to the nearest 100 million metric tons (Mt) to account for data variability. The key sources of uncertainty include the lifetime estimates of various product categories and the accuracy of recycling and incineration rates outside well-documented regions such as Europe and the United States.
Adjusting the mean product lifetimes by one standard deviation (±1 SD) alters the cumulative primary plastic waste generation between 1950 and 2015 from 5,900 Mt to a range of 4,600–6,200 Mt, reflecting a margin of −4% to +5%. Similarly, changing global incineration and recycling rates by ±5%, and adjusting historical trends accordingly, shifts the total discarded plastic waste from 4,900 Mt to 4,500–5,200 Mt, a variation of −8% to +6%.
Over the last 65 years, plastic production has expanded faster than any other manufactured material. Ironically, the same characteristics that make plastics valuable durability, light weight, and resistance to degradation also make them persistent environmental pollutants. Without robust, well-designed systems for end-of-life plastic management, humanity is effectively conducting a global-scale uncontrolled experiment, allowing billions of tons of plastics to accumulate across terrestrial and aquatic ecosystems.
To mitigate this mounting challenge, there is an urgent need for comprehensive waste management strategies that balance environmental and economic outcomes. Approaches such as material dematerialization, substitution with sustainable alternatives, reuse, mechanical and chemical recycling, waste-to-energy technologies, and conversion processes should be carefully evaluated. Developing a tailored, multi-layered global strategy will be critical to addressing the escalating consequences of continued plastic production and the persistence of plastic waste in the environment.
Materials and Methods
Plastic Production
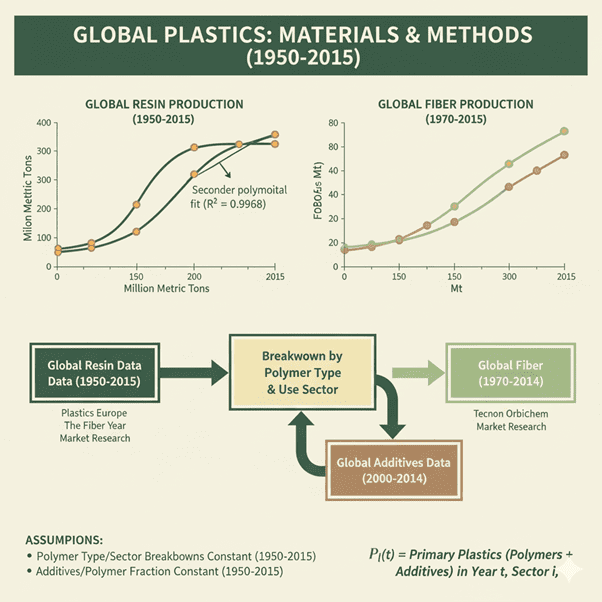
The plastic production model was developed using global annual data on pure polymer resins and synthetic fibers from 1950 to 2015. Resin production statistics were obtained from international industry reports, while fiber production data were compiled from leading global textile and chemical market sources.
The analysis showed that resin production followed a consistent growth pattern that aligned closely with a second-order polynomial trend, while fiber production fit a third-order polynomial curve. Both datasets demonstrated a very high level of accuracy and reliability, confirming a steady and predictable increase in global plastic output over time.
To understand production patterns more comprehensively, global data were analyzed by polymer type and industrial use sector, using information collected from major producing regions including North America, Europe, China, and India. Production characteristics such as polymer composition and application distribution were found to be broadly consistent across all regions.
Since comprehensive data on additives were not publicly available, these figures were acquired from specialized market research sources and cross-checked for consistency. Additives data, available for the early 2000s onward, showed that both the ratio of additives to polymers and the production distribution by industry remained stable over time. Therefore, these proportions were assumed to be constant throughout the entire modeling period from 1950 to 2015. Minor errors from earlier decades were considered negligible due to lower production levels during that time.
The data on additives were further classified by type such as plasticizers, stabilizers, fillers, and flame retardants and by industrial use category. These values were then integrated with polymer data to build a complete global plastic production model. In this model, Pi(t) denotes the amount of primary plastics (polymers plus additives) produced in a given year and utilized within a specific industry sector.
Plastic Waste Generation and Fate
Plastic use across different industries was analyzed using log-normal lifetime distributions, which represent how long various plastic products remain in use before being discarded. The average lifespans and standard deviations for each category were derived from existing research, accounting for variations across economies and demographic groups. This approach allowed for a realistic estimation of how plastics flow through their life cycle and eventually become waste.
The total quantity of primary plastic waste generated in any given year was determined by combining production data with these lifetime models. Secondary plastic waste, which originates from recycled materials, was calculated as a fraction of the total waste that had been recycled in previous years. This method factors in the average duration that recycled plastics remain in use, as well as annual recycling rates.
To understand the final outcomes of plastic waste, it was categorized into discarded, incinerated, and recycled portions. The discarded amount includes all plastic waste deposited in landfills or released into the environment, while the incinerated portion represents plastics destroyed through thermal treatment processes. Cumulative totals for each category were then calculated by summing annual values from 1950 onward, giving a complete picture of global plastic waste accumulation over time.
This analytical model highlights the interconnected nature of production, consumption, and waste management, offering a foundation for projecting how future changes in recycling efficiency, product lifespan, and consumption rates could influence global plastic waste trends.
Recycling, Incineration, and Discard Rates
Time-series data on the recycling, incineration, and disposal of nonfiber plastics were compiled separately for four major global regions: the United States, Europe (including the EU-28, Norway, and Switzerland), China, and the rest of the world. Comprehensive waste management statistics for the United States have been published by the Environmental Protection Agency (EPA) since the 1960s, while European data were sourced from multiple industry and government reports covering the late 1990s onward. Information for China was consolidated from the English edition of the China Statistical Yearbook, translated research publications, government releases, and supporting literature on solid waste management. Data for other regions were primarily drawn from international development and environmental databases.
To obtain global averages, recycling, incineration, and discard rates from these four regions were combined using a weighted approach based on each region’s relative contribution to total plastic waste generation. In many developing regions, data availability was limited and of uneven quality; therefore, sensitivity analyses were performed to assess the impact of uncertainty in regional waste management rates on global estimates.
Results showed that the global nonfiber plastic recycling rate increased steadily by approximately 0.7% per year between 1990 and 2014. If this linear trend continues, the worldwide recycling rate could reach around 44% by 2050. The global incineration rate has shown a less consistent pattern but has grown at an average pace of 0.7% per year since 1980. Extending this trend suggests a potential 50% incineration rate by 2050. Correspondingly, the discard rate representing plastics that end up in landfills or the environment would likely decline from 58% in 2014 to roughly 6% by 2050, assuming current progress continues.
It is important to note that these figures represent forward projections of historical trends, not precise forecasts. They indicate potential outcomes based on past behavior, rather than policy-driven scenarios or future interventions. Additionally, there is currently no substantial recycling of synthetic fibers worldwide; therefore, it is assumed that end-of-life textiles are primarily incinerated or discarded along with other types of municipal solid waste.
The dataset below presents an overview of plastic generation and waste management trends from 1960 to 2018, highlighting how plastics produced for Canadian consumption were handled at the end of their life cycle. The data illustrate the quantities (in tons) of plastics that were generated, recycled, composted, combusted with energy recovery, and disposed of in landfills over nearly six decades.
This timeline reflects the evolution of plastic production and disposal practices in Canada. During the early years, the majority of plastic waste was sent directly to landfills, with minimal recycling or energy recovery efforts. However, as environmental awareness and technological advancements grew, recycling programs and waste-to-energy systems began to play an increasingly important role in managing plastic waste.
The accompanying table and graph provide a visual representation of these long-term trends, illustrating both the growth in total plastic production and the gradual shift toward recycling and energy recovery as part of a broader move toward sustainable waste management.
Request Research Report Built Around Your Goals: sales@towardspackaging.com
For access to the complete report and in-depth market insights, contact Towards Packaging. To explore tailored consulting services or request a custom-built research report aligned with your strategic goals, connect with us today at sales@towardspackaging.com. Invest in our Premium Strategic Solution to gain data-driven perspectives and stay ahead in the evolving global packaging and plastics landscape.
More Insights by Towards Packaging in Plastic Industry:
- Rigid Plastic Packaging Market Size, Segments, Regional Outlook (NA, EU, APAC, LA, MEA)
- Plastic Packaging Market Size (2025-2034), Segment Data, Regional (NA/EU/APAC/LA/MEA)
- Pharmaceutical Plastic Packaging Market Size, Segments, Regional Trends
- PCR Plastic Packaging Market Size, Share, Segments, Trends and Key Players
- Flexible Plastic Packaging Market Growth, Key Segments, and Regional Dynamics
- Plastic Food Packaging Market Size, Segments, and Regional Analysis
- Virgin Plastic Packaging Market Size, Share, Regional Insights, Segments
- Plastic Compounding Market Size, Segments, Regional Data (NA/EU/APAC/LA/MEA)
- Plastic Healthcare Packaging Market Size, Segmentation, Growth Insights
- Bioplastic Packaging Market Size, Segments, Regional Insights
- Corrugated Plastic Tray Market Size, Share, Segments, Regional Outlook
- Plastic Recycling Services Market Outlook Scenario Planning & Strategic Insights
- Plastic Bag Market Strategic Growth, Innovation & Investment Trends
- Clear Plastic Tube Packaging Market Consumer Insights & Growth Strategies

![]()
Legal Disclaimer:
EIN Presswire provides this news content "as is" without warranty of any kind. We do not accept any responsibility or liability for the accuracy, content, images, videos, licenses, completeness, legality, or reliability of the information contained in this article. If you have any complaints or copyright issues related to this article, kindly contact the author above.
